How to use the API with JavaScript and D3
DLUHC Open Data provides highly flexible programmatic access to its data, through the SPARQL endpoint. This API can be used to automate report-writing, publish data visualisations, or interactive tools for exploring the data. This guide describes how to get the results of a SPARQL query into a web application, using HTML, Javascript and CSS.
Using the APIs to get data into a web-based visualisation is one of the more advanced end of these guides. There is documentation provided alongside the SPARQL endpoint in the API tab. This explains how to perform GET and POST requests, as well as examples of using cURL and Javascript.
Here, we will look at using a POST request to get the results of a query out of MHCLG Open Data, and display them in both a table, and a simple chart. This guide assumes some technical knowledge of HTML, CSS and Javascript.
The first thing that we need to do is write the SPARQL query. We will use the query that we used in the SPARQL guide, to get the number of rough sleepers in local authorities. For the purposes of this (slightly contrived!) exercise, to make the dataset more manageable, we’ll filter the results to show only 2016 data, and only Local Authorities who’s name starts with a ‘P’. This means our query looks like this:
PREFIX rdfs: <http://www.w3.org/2000/01/rdf-schema#>
SELECT ?areaname ?periodlabel ?value
WHERE {
	?obs <http://purl.org/linked-data/cube#dataSet> <http://opendatacommunities.org/data/homelessness/rough-sleeping/count> .
	?obs <http://opendatacommunities.org/def/ontology/geography/refArea> ?areauri .
	?obs <http://opendatacommunities.org/def/ontology/time/refPeriod> ?perioduri .
	?obs <http://opendatacommunities.org/def/ontology/homelessness/roughSleepingObs> ?value .
	?areauri rdfs:label ?areaname .
	?perioduri rdfs:label ?periodlabel .
FILTER (?periodlabel = "2016" && regex(?areaname,"^P"))
}
ORDER BY ?areaname
We can then build the post request. For our query, the request looks like this:
<script> var query = 'PREFIX rdfs: <http://www.w3.org/2000/01/rdf-schema#> SELECT ?areaname ?periodlabel ?value WHERE { ?obs <http://purl.org/linked-data/cube#dataSet> <http://opendatacommunities.org/data/homelessness/rough-sleeping/count> .?obs <http://opendatacommunities.org/def/ontology/geography/refArea> ?areauri . ?obs <http://opendatacommunities.org/def/ontology/time/refPeriod> ?perioduri . ?obs <http://opendatacommunities.org/def/ontology/homelessness/roughSleepingObs> ?value . ?areauri rdfs:label ?areaname . ?perioduri rdfs:label ?periodlabel . FILTER (?periodlabel = "2016" && regex(?areaname,"^P")) } ORDER BY ?areaname';

var url = 'http://opendatacommunities.org/sparql.json';

$.ajax({
	method: 'POST',
	dataType: 'json',
	url: url,
	data: {query: query},
 	success: function(data) {
 		var bindings = data.results.bindings
	}
	});
</script>
This will put the results of our query into an object called bindings. Once we have our data in this object, we can do all sorts of things with it.
Make a simple HTML table with the results
The first thing we’ll do is draw a table of the results of the query. To do this, we’re just going to push each element of the array into a html table.
var tableContent = ""
for (var i = 0; i < bindings.length; i++) {
	tableContent += '<tr><td>' + bindings[i]["areaname"]["value"] + '</td><td>' + bindings[i]["value"]["value"] + '</td></tr>'
}
$('#sampletable').html(tableContent);
This block of code creates an empty variable, called tableContent, and then loops through the bindings object with our data in, building a html table. Once the tableContent variable is full, it gets pushed to the <table> element in our DOM with the id “sampletable”:

Use the results in D3.js
There are many ways to style this table using CSS, but we’re not going to cover that here. What we’re going to do next is use the same data to draw a chart on the webpage, using a Javascript library called D3.js. D3.js is a tremendously powerful tool for making visualisations using data. It does have quite a steep learning curve, so we’re going to start simple, with a basic bar chart.
We have already made the API call when we created the table above, so we don’t need to do that again. Beneath the code to draw the table, we can define the canvas that our bar chart will be drawn on:
var margin = {top: 20, right: 20, bottom: 70, left: 40},
		width = 600 - margin.left - margin.right,
		height = 300 - margin.top - margin.bottom;
var x = d3.scale.ordinal().rangeRoundBands([0, width], .05);
var y = d3.scale.linear().range([height, 0]);
var xAxis = d3.svg.axis()
		.scale(x)
		.orient("bottom");
var yAxis = d3.svg.axis()
		.scale(y)
		.orient("left")
		.ticks(10);
var svg = d3.select("body").append("svg")
		.attr("width", width + margin.left + margin.right)
		.attr("height", height + margin.top + margin.bottom)
		.append("g")
		.attr("transform","translate(" + margin.left + "," + margin.top + ")");
This codeblock sets the size of the space for the chart, the range of the axes, and attaches the blank canvas to the <body> element of the DOM.
Next, we deal with the data:
var data = bindings ;
x.domain(data.map(function(d) { return d["areaname"]["value"]; }));
y.domain([0, d3.max(data, function(d) { return d["value"]["value"]; })]);
These are functions within d3 to get the data out of the bindings array, and into the right shape to allow d3 to draw the chart.
Finally, we use the data to create the chart.
svg.append("g")
	.attr("class", "x axis")
	.attr("transform", "translate(0," + height + ")")
	.call(xAxis)
	.selectAll("text")
	.style("text-anchor", "end")
	.attr("dx", "-.8em")
	.attr("dy", "-.55em")
	.attr("transform", "rotate(-90)" );

svg.append("g")
	.attr("class", "y axis")
	.call(yAxis)
	.append("text")
	.attr("transform", "rotate(-90)")
	.attr("y", 6)
	.attr("dy", ".71em")
	.style("text-anchor", "end")
	.text("No of Rough Sleepers");

svg.selectAll("bar")
	.data(data)
	.enter().append("rect")
	.attr("x", function(d) { return x(d["areaname"]["value"]); })
 	.attr("class","bar")
	.attr("width", x.rangeBand())
 	.attr("y", function(d) { return y(d["value"]["value"]); })
 	.attr("height", function(d) { return height - y(d["value"]["value"]); });
These three blocks of code above create the x axis, the y axis, and the rectangles of the bar chart.
Some basic CSS at the top of the page gives some formatting:
<style type="text/css">
body {
	font-family: sans-serif;
}
.axis path, .axis line {
	fill: none;
	stroke: black;
	shape-rendering: crispEdges;
}
.axis text {
	font-family: sans-serif;
	font-size: 11px;
}
.sampletable th, td {
	border-bottom: 1px solid #ddd;
}
.bar {
	fill: steelblue;
}
.bar:hover {
	fill: brown;
}
</style>
And finally the html elements provide the structure for the webpage:
<body>
  <h2>Using the OpenDataCommunities API to pull data into a webpage</h2>
  <p>This table has been generated using the results of SPARQL query using an API call</p>
  <table id='sampletable'></table>
  <br />
  <br />
  <p>This simple bar chart has been generated using the results of a SPARQL query from OpenDataCommunities, using an API call</p>
  <br />
  <br />
</body>
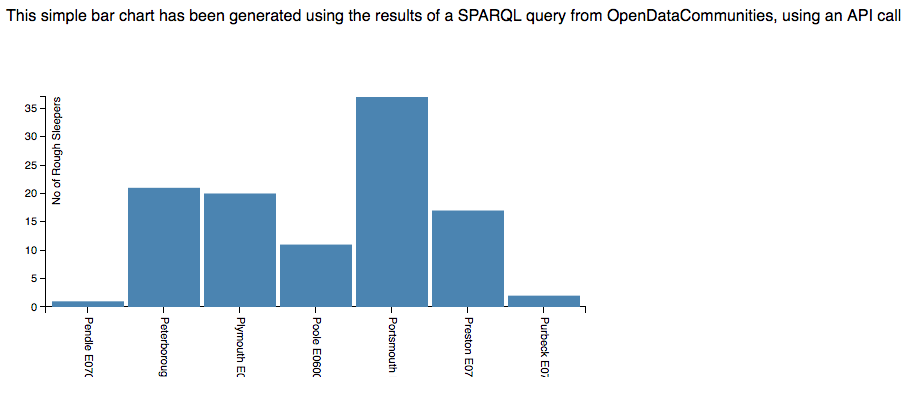
This is the final piece needed to make the bar chart, and gives us this:
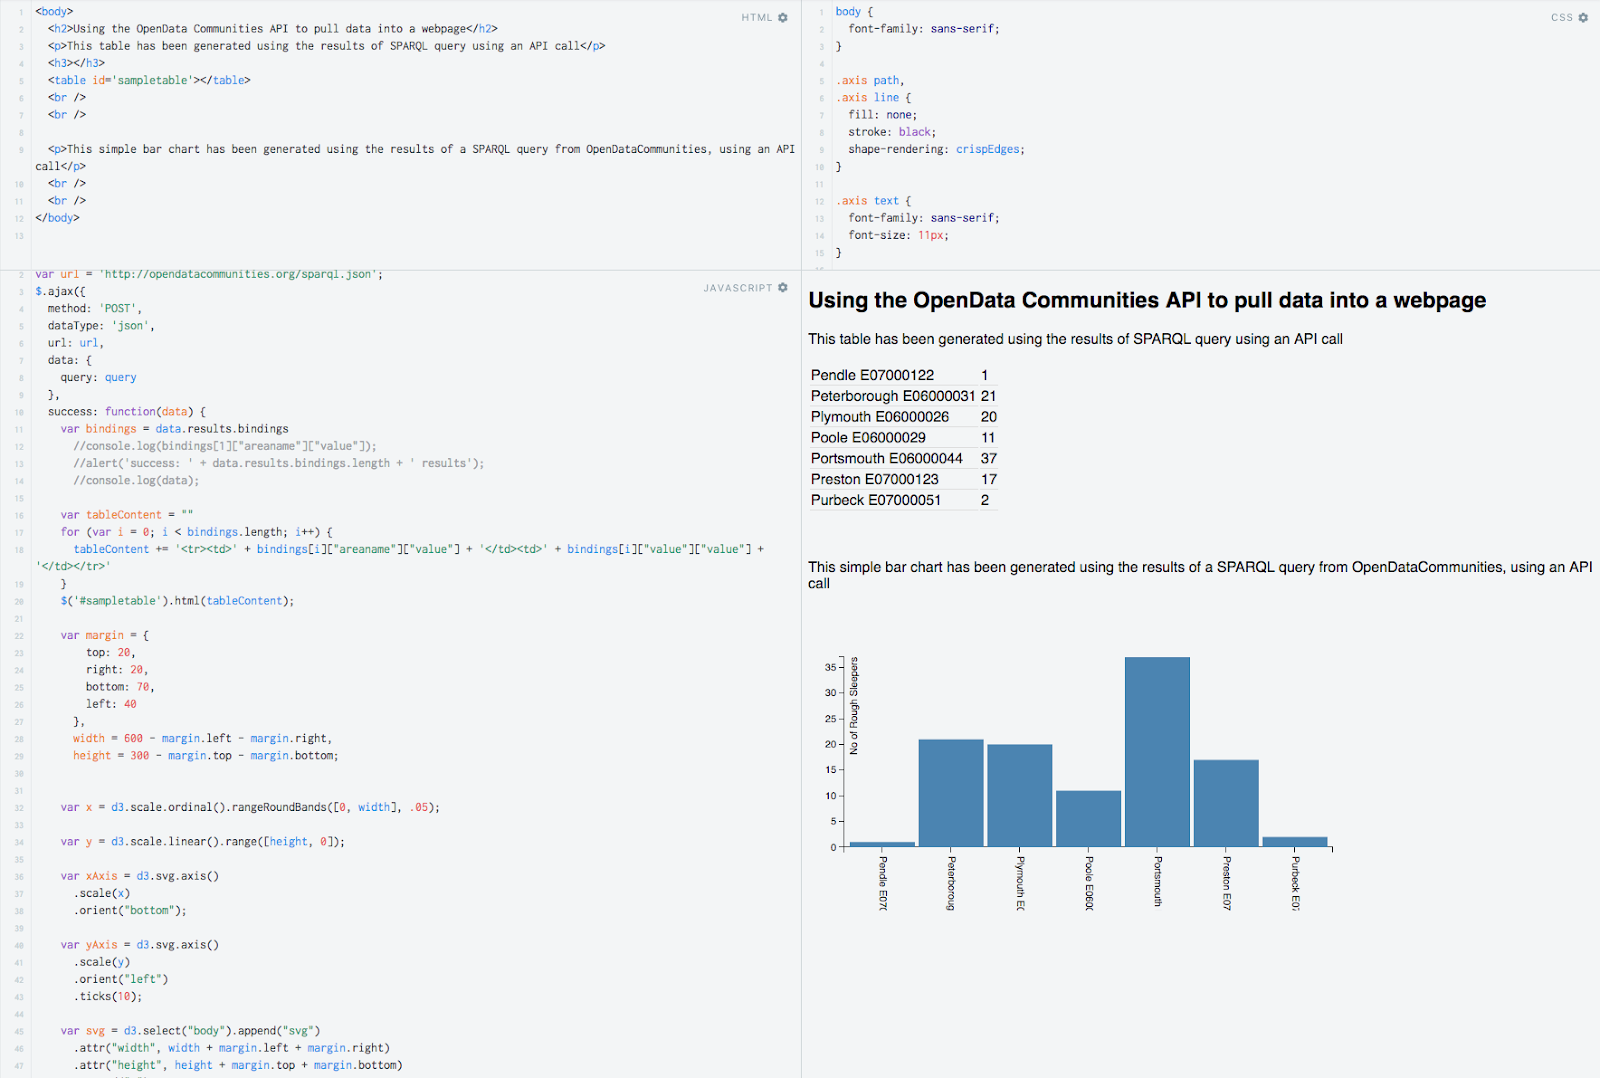
Putting all of these different components together gives us this:
<!DOCTYPE html>
<html>
  <head>
    <!-- Load D3 from site -->
    <script src="http://d3js.org/d3.v3.min.js" charset="utf-8"></script>
    <script src='http://code.jquery.com/jquery-1.9.1.min.js'></script>
  </head>
  <!-- CSS (Styling) -->
  <style type="text/css">
    body {
	font-family: sans-serif;
    }
    .axis path, .axis line {
	fill: none;
	stroke: black;
	shape-rendering: crispEdges;
    }
    .axis text {
	font-family: sans-serif;
	font-size: 11px;
    }
    .sampletable th, td {
	border-bottom: 1px solid #ddd;
    }
    .bar {
	fill: steelblue;
    }
    .bar:hover {
	fill: brown;
    }
  </style>
  <!-- End CSS (Styling) -->
<body>
  <h2>Using the OpenDataCommunities API to pull data into a webpage</h2>
  <p>This table has been generated using the results of SPARQL query using an API call</p>
  <table id='sampletable'></table>
  <br />
  <br />
  <p>This simple bar chart has been generated using the results of a SPARQL query from OpenDataCommunities, using an API call</p>
  <br />
  <br />
  <script>

var query = 'PREFIX rdfs: <http://www.w3.org/2000/01/rdf-schema#> SELECT ?areaname ?periodlabel ?value WHERE { ?obs <http://purl.org/linked-data/cube#dataSet> <http://opendatacommunities.org/data/homelessness/rough-sleeping/count> .?obs <http://opendatacommunities.org/def/ontology/geography/refArea> ?areauri . ?obs <http://opendatacommunities.org/def/ontology/time/refPeriod> ?perioduri . ?obs <http://opendatacommunities.org/def/ontology/homelessness/roughSleepingObs> ?value . ?areauri rdfs:label ?areaname . ?perioduri rdfs:label ?periodlabel . FILTER (?periodlabel == “2016” && regex(?areaname,”^P”)) } ORDER BY ?areaname';

var url = 'http://opendatacommunities.org/sparql.json';


$.ajax({
	method: 'POST',
	dataType: 'json',
	url: url,
 	data: {query: query},
 	success: function(data) {
 		var bindings = data.results.bindings
 		var tableContent = ""
		for (var i = 0; i < bindings.length; i++) {
			tableContent += '<tr><td>' + bindings[i]["areaname"]["value"] + '</td><td>' + bindings[i]["value"]["value"] + '</td></tr>'
		}
 		$('#sampletable').html(tableContent);
  		var margin = {top: 20, right: 20, bottom: 70, left: 40},
			width = 600 - margin.left - margin.right,
			height = 300 - margin.top - margin.bottom;
		var x = d3.scale.ordinal().rangeRoundBands([0, width], .05);
		var y = d3.scale.linear().range([height, 0]);
		var xAxis = d3.svg.axis()
				.scale(x)
				.orient("bottom");
		var yAxis = d3.svg.axis()
				.scale(y)
				.orient("left")
				.ticks(10);
		var svg = d3.select("body").append("svg")
				.attr("width", width + margin.left + margin.right)
				.attr("height", height + margin.top + margin.bottom)
				.append("g")
				.attr("transform","translate(" + margin.left + "," + margin.top + ")");
		var data = bindings ;
		x.domain(data.map(function(d) { return d["areaname"]["value"]; }));
		y.domain([0, d3.max(data, function(d) { return d["value"]["value"]; })]);

		svg.append("g")
			.attr("class", "x axis")
			.attr("transform", "translate(0," + height + ")")
			.call(xAxis)
			.selectAll("text")
			.style("text-anchor", "end")
			.attr("dx", "-.8em")
			.attr("dy", "-.55em")
			.attr("transform", "rotate(-90)" );

		svg.append("g")
			.attr("class", "y axis")
			.call(yAxis)
			.append("text")
			.attr("transform", "rotate(-90)")
			.attr("y", 6)
			.attr("dy", ".71em")
 			.style("text-anchor", "end")
			.text("No of Rough Sleepers");

 		svg.selectAll("bar")
			.data(data)
			.enter().append("rect")
			.attr("x", function(d) { return x(d["areaname"]["value"]); })
			.attr("class","bar")
			.attr("width", x.rangeBand())
			.attr("y", function(d) { return y(d["value"]["value"]); })
			.attr("height", function(d) { return height - y(d["value"]["value"]); });
 		}
 });
</script>
</body>
</html>
You can also see all of this code in this JSFiddle, which is a web-based tool for demonstrating and testing code. JSFiddle also allows a user to modify the code, so you can try modifying the settings, such as the CSS styling, or the SPARQL query.
To continue exploring our datasets, return toopendatacommunities.org