View data as a spreadsheet
Statistical data is often published in the form of a multidimensional dataset (or "data cube"). Although the term may be unfamiliar it’s a very understandable and useful concept. If you want more background on multidimensional data, this blog post might help to explain it
Many datasets on DLUHC Open Data have more than 2 dimensions (i.e. they break the data down in several ways) which means you can't view them in the familiar rows vs columns format in a single table without first making some choices about what you want to view.
An example of this is Deprivation data. The dimensions for this dataset are:
- Indices of deprivation (Here you can select which index you're interested in: IMD, income, employment, education, etc)
- Measure type (decile, rank or score)
- Reference period (the year)
- Reference area (the area for which deprivation is recorded)
Given the above example, you could have a whole series of possible spreadsheets. If someone was preparing this as an Excel workbook you could have a series of worksheets, but the author would need to decide which dimensions to use as the sheets and which as the columns (and as a user, you'd be stuck with that choice!). But data cubes on DLUHC Open Data let you make the choice yourself.
This guide shows how to filter our search further to get from a dataset to a familiar spreadsheet view. If you need help finding a dataset, try these guides.
For this guide, we’ll be finding a spreadsheet showing us the number of households accepted as homeless, across different authorities and all ethnicities.
Start with the dataset: Homelessness Acceptances England, District by Ethnicity.

To narrow this down to a spreadsheet view of the data we want, we need only two 'free" dimensions (for rows and columns). In this dataset, however, there are three dimensions: Ethnicity, Reference Period and Reference Area. In OpenDataCommunities, Areas are always the rows of the spreadsheet, so we need to "lock" one of the dimensions to a single value.
To view ethnicities (as columns) and areas (as rows) on our spreadsheet, we need to lock down the other dimension: Reference Period. There are lots of reference periods to choose from in this dataset. To lock the most recent reference period (at the time of writing) click 2017 Q1. The page will reload, and a lock icon will appear next to the locked dimension.

After selecting (locking) this Reference Period, you should see a spreadsheet view of a range of ethnicities and areas for the first quarter of 2017:

Once you've arrived at a spreadsheet, you can still change what you see by using the links below the spreadsheet view.The table of dimensions that we locked to get our spreadsheet view is still below the spreadsheet itself.
So, for example, If you wanted to change the Reference Period so it’s no longer 2017 Q1, you can select (lock) a different reference period.
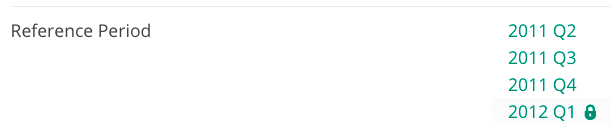
This will give you a spreadsheet for homelessness across ethnicities and area for the first quarter of 2012:

Once you’ve made your spreadsheet you can download it by clicking the CSV link beneath the list of dimensions.

You can also build you own custom spreadsheets (with data from multiple datasets) using the Data Cart tool.
Summary
- Start with a dataset.
- Decide on the two dimensions you want to view on a spreadsheet.
- So you can view the two dimensions we want, you need to keep the other dimensions static (locked). Lock any dimensions we don’t want to view on our spreadsheet by clicking them. An image of a lock will appear by them when this is done.
- View the spreadsheet.
- To edit the spreadsheet view, lock different dimensions
- Optionally download as CSV.
To continue exploring our datasets, return to opendatacommunities.org